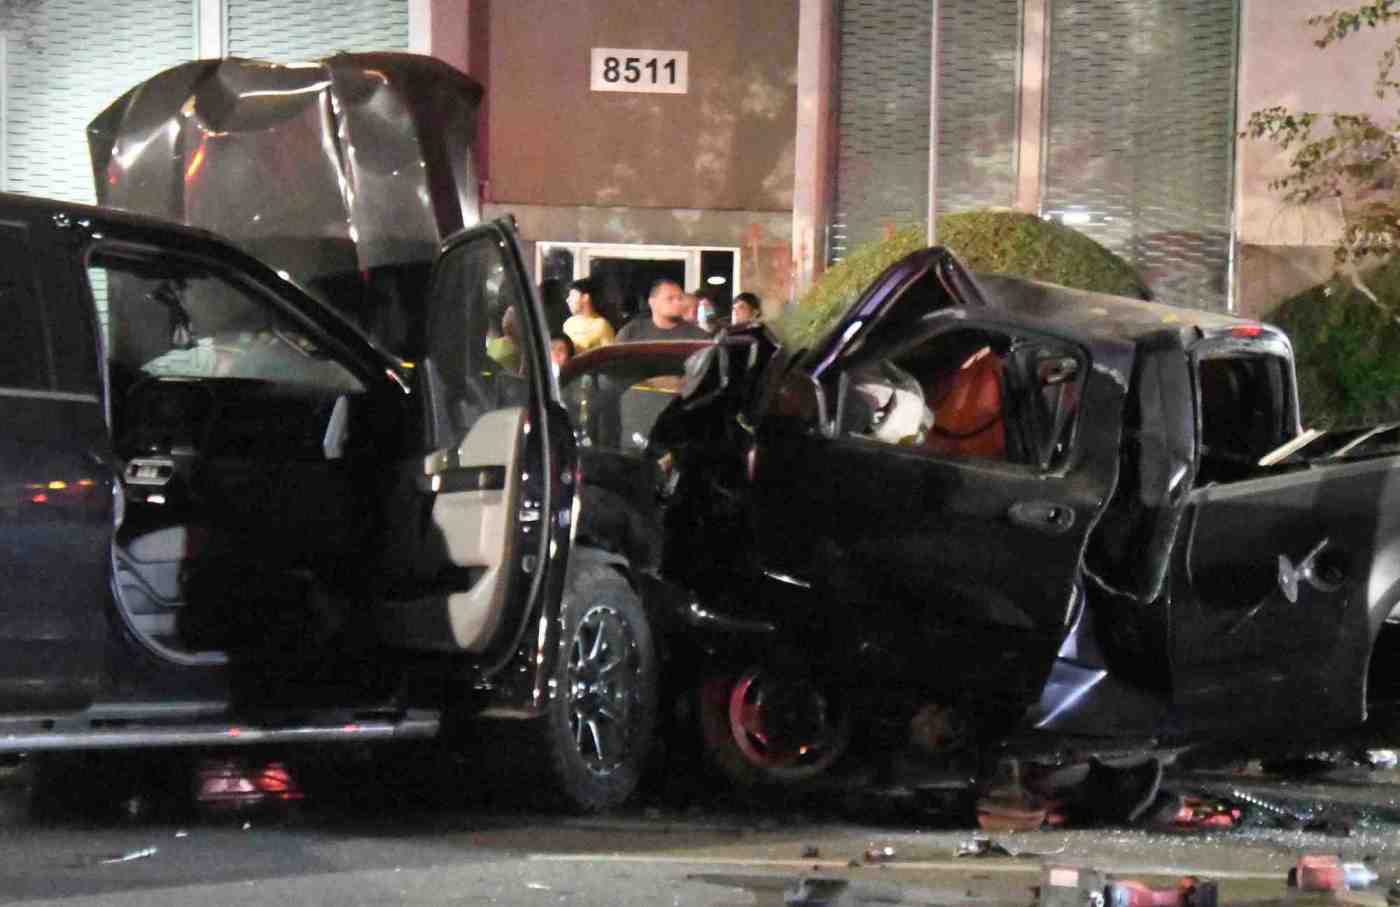
Halloween is a time for costumes, candy corn – and lethal car crashes.
California suffered the nation’s third-highest number of Halloween fatal driving accidents, according to a study of auto safety stats from the Bader Scott law firm from Georgia.
My trusty spreadsheet looked at the firm’s analysis of federal crash data for 2013 through 2022 that tracked drivers involved in vehicle fatalities by state – on Halloween compared with the eight weeks surrounding the fall festival.
Car wrecks aren’t what I usually write about. But hopefully, people note this trend: California averaged 14.6 fatal Halloween crashes during this decade. That was topped only by Florida’s 15.8 and 15 in Texas. After California came Georgia at 7.7 and Pennsylvania at 6.2.
The fewest fatal drives were in Vermont, with none, while Hawaii, North Dakota, Delaware, and Wyoming all averaged below 0.4 fatalities on Halloween.
Now, these leading states are some of the nation’s most populous. So that size means they also topped the average deadly drives for a day in the eight weeks around the trick-or-treat day too.
California’s 15.7 average daily fatal wrecks was exceeded only by Texas at 15.8. After California came Florida at 12.8, Georgia at 6.4, and North Carolina at 6.1. Lows? Vermont, Rhode Island, Alaska, Hawaii and Wyoming – all below 0.4 deaths a day.
But the key safety number by Bader Scott’s math, is how Halloween fatalities compare with seasonal patterns.
California looks relatively good by this measurement. Its Halloween deaths ran 6% below the seasonal norm. That was the 22nd best outcome among the states, tying Texas.
Nationally, Halloween drivers killed 7% more than the season’s average.
The worst place for Halloween drivers was Alaska, where deadly wrecks ran 195% above the seasonal average. Then came Rhode Island at 140%, Maine at 94%, South Dakota at 92%, and Kentucky at 88%. Florida was 13th highest, up 25%.
The safest spot, outside of Vermont’s zero fatalities, was Hawaii, with deaths 75% below par. That was followed by North Dakota, off 65%, Kansas, off 39%, and New Jersey, off 30%.
Halloween is a party day and that makes it dangerous for driving. Please be smart.
Consider that this yardstick, nationwide, says the ghost-and-goblins day had the third-highest seasonal bump in fatal drives among 13 big US holidays tracked.
The most dangerous was party-hearty New Year’s Day, with driving fatalities 17% above the seasonal average. Next was another day for big bashes – the Fourth of July, 12% above par.
After Halloween came Juneteenth (4% above average), Easter Sunday (1% above), Labor Day (1% below average), Thanksgiving Day (2% below), Martin Luther King Jr. Day (4% below), Memorial Day (4% below), Veterans Day (6% below), Presidents’ Day (13% below), Columbus Day (14% below), and the safest holiday – perhaps curiously – Christmas (19% below).
Jonathan Lansner is the business columnist for the Southern California News Group. He can be reached at jlansner@scng.com
Related Articles
Access to the Clean Vehicle Tax Credit continues to improve
Lucid Air Pure takes top honors In Best of the Bay showcase
The 2024 Ford F-150 King Ranch Supercrew Hybrid 4×4 Pickup Truck
Me & My Car: ’58 Triumph in Pleasant Hill will soon be well restored
2024 Honda Ridgeline a worthy outlier
