Daily life in the Bay Area changed dramatically five years ago. Schools went online. Offices went remote. People followed a 6-foot rule as they searched mostly empty grocery shelves for toilet paper and hand sanitizer.
In response to the growing coronavirus pandemic, the region’s public health officials announced an expansive and unprecedented shelter-in-place order on March 16, 2020. Life changed in an instant and in unexpected ways.
Related Articles
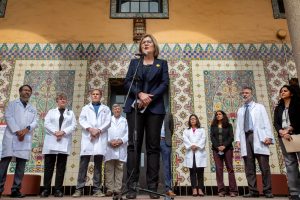
Dr. Sara Cody, public health official who led Santa Clara County’s COVID response, to retire
Bay Area tech workers see post-COVID hiring boom morph into jobs bust
California orders nearly 100,000 workers to return to offices
The COVID ‘contrarians’ are in power. We still haven’t hashed out whether they were right
Large California school district will no longer make new employees prove they’re vaccinated against COVID-19
Five years later, much has returned to pre-pandemic normals. But not completely. In ways big and small, Bay Area residents are still coping with COVID-19.
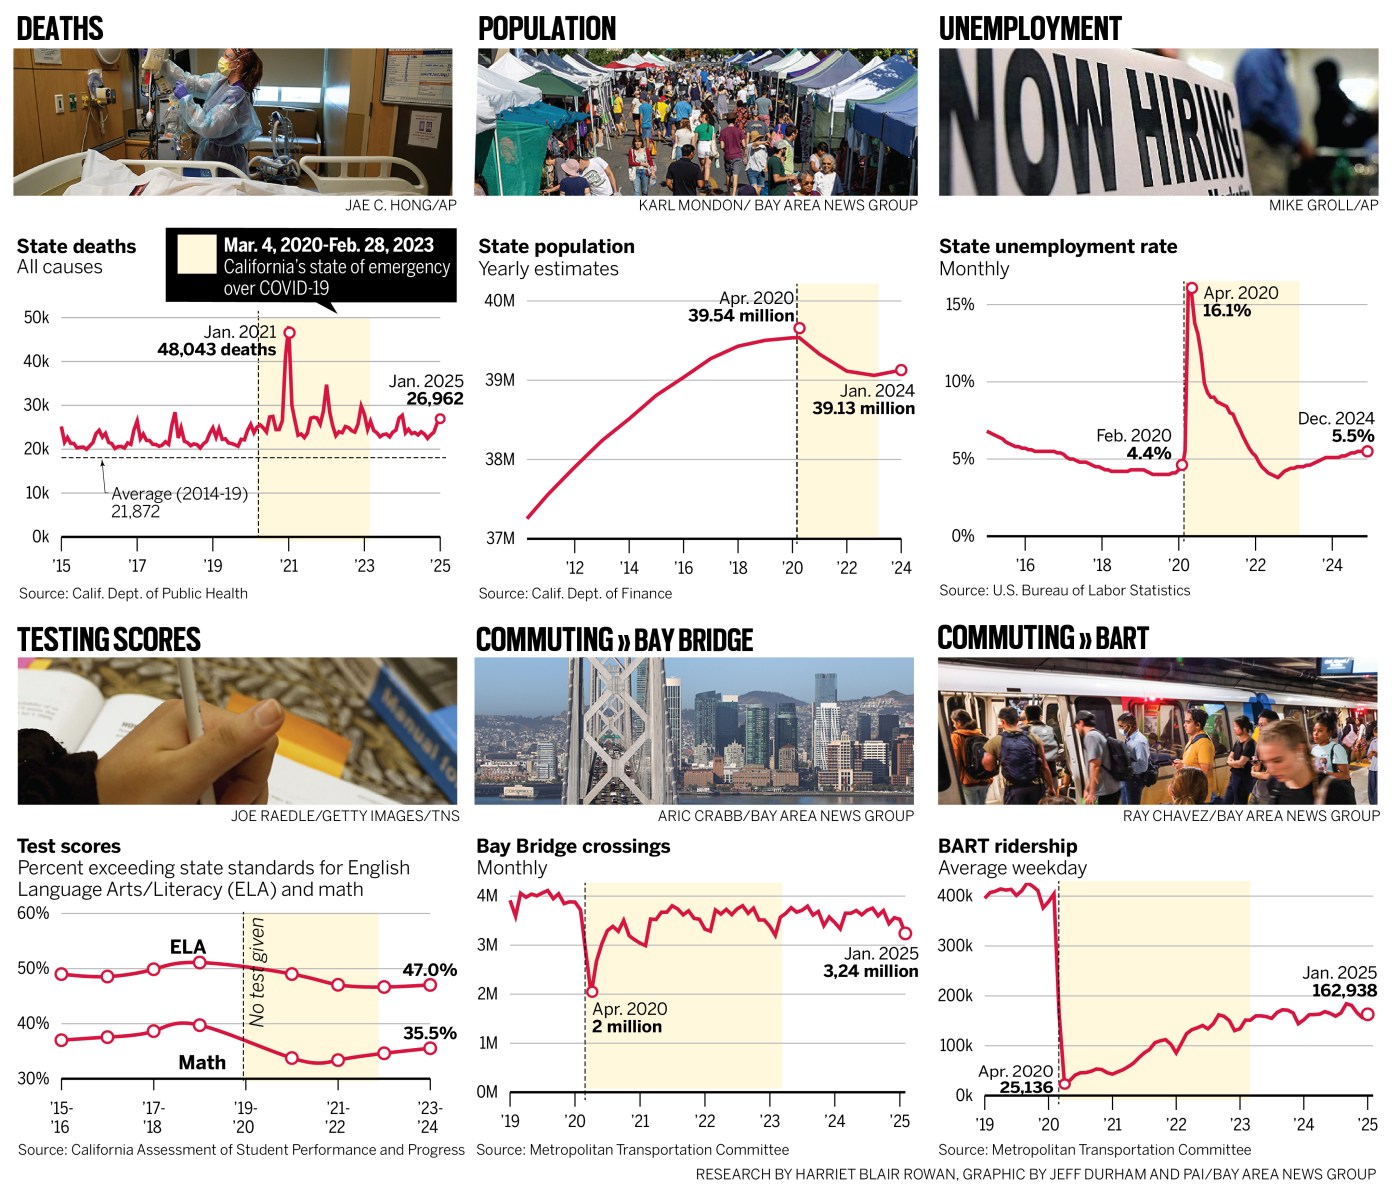
Monthly total deaths have settled, but still higher than pre-pandemic normal
The early shutdown in the Bay Area and California is often credited with the region’s lower-than-average COVID death rates. Still, over the last five years, the death certificates of more than 110,000 California residents list COVID as the cause.
Mortality patterns have not quite returned to normal. California’s death totals from all causes have remained above the 2016-2019 average each month since 2020, sometimes much higher.
Before 2020, influenza was the only infectious disease that caused notable fluctuations in death totals. But starting in early 2020, COVID changed the baseline.
The deadliest month in the years before the pandemic was January 2018, during a bad flu season, when 28,400 people died in the state. But a jaw-dropping 48,000 died in January 2021.
COVID deaths alone do not account for the entire increase, though it does explain a large portion.
“The health care system has been profoundly perturbed by the pandemic,” said John Swartzberg, clinical professor emeritus at the UC Berkeley School of Public Health.
“COVID caused a lot of premature deaths from heart attacks,” Swartzberg said. “Also the disruption had effects on the populace that were deleterious to its health: increased alcohol consumption, decreased activity, depression.”
Unemployment rate returned to pre-pandemic levels after two years
The rate of unemployed California residents remained steady, around 4%, in the two years leading up to the pandemic, but jumped to over 16% by April 2020, when pandemic shutdowns and disruptions caused so many people to lose their jobs.
It took a little more than two years, but by the summer of 2022 unemployment rates were back around 4%. Since then, the rate has been steadily increasing, reaching 5.5% in December 2024, up from the post-pandemic low of 3.8% in August 2022, though unemployment rates don’t tell the whole story.
Rise of working from home has profoundly changed transportation
Ridership on BART plummeted when the shelter-in-place orders were issued, from an average weekday ridership of around 400,000 in 2019 to just 25,000 in April 2020. But while many people have returned to their offices, BART ridership was about 163,000 in January 2025.
“BART ridership has hovered around 40% of pre-pandemic volume” said Abby Raisz, research director at the Bay Area Council Economic Institute.
The number of people crossing the San Francisco–Oakland Bay Bridge dropped by about half in April 2020 but mostly recovered after the first 12 months.
“Generally speaking, since late 2020, like the Bay Bridge traffic volumes have been … around 90% of what they were pre-pandemic,” Raisz said.
California students are still trying to catch up
When the pandemic shutdown started, students were sent home and spent months in virtual classrooms, where many struggled to keep up. And the proof is in the test scores.
The percent of California students who met or exceeded standards for English language and mathematics testing had been on a slightly positive trajectory in the years leading up to the 2018-19 school year, with just over 51% of students meeting language expectations that year.
Now just 47% of students meet those standards for language.
Math aptitude has always trended lower but was also on a positive trajectory through the 2018-19 school year when about 40% of students met or exceeded the standard. Now, 35.5% of students in the Golden State met the standard for math last year, still well shy of pre-pandemic levels despite slight gains in the last two years.
California’s population is growing again after two years of big exodus drops
COVID impacted California’s population profoundly — hundreds of thousands moved out of the state in the first two years of the pandemic, a trend referred to as the exodus.
The causes for the California exodus, which was even more pronounced in the Bay Area, has been hotly debated. Many point to the extra-strict pandemic regulations imposed by public health officials locally and statewide, and the high and rapidly increasing cost of living is often cited.
The latest updates show that California is back to year-over-year population growth.
In the Bay Area, “foreign immigration is back to a level that we hadn’t really seen since around 2019,” Raisz said.