“How expensive?” tracks measurements of California’s totally unaffordable housing market.
The pain: Housing eats up at least half of paychecks in one-fifth of California households.
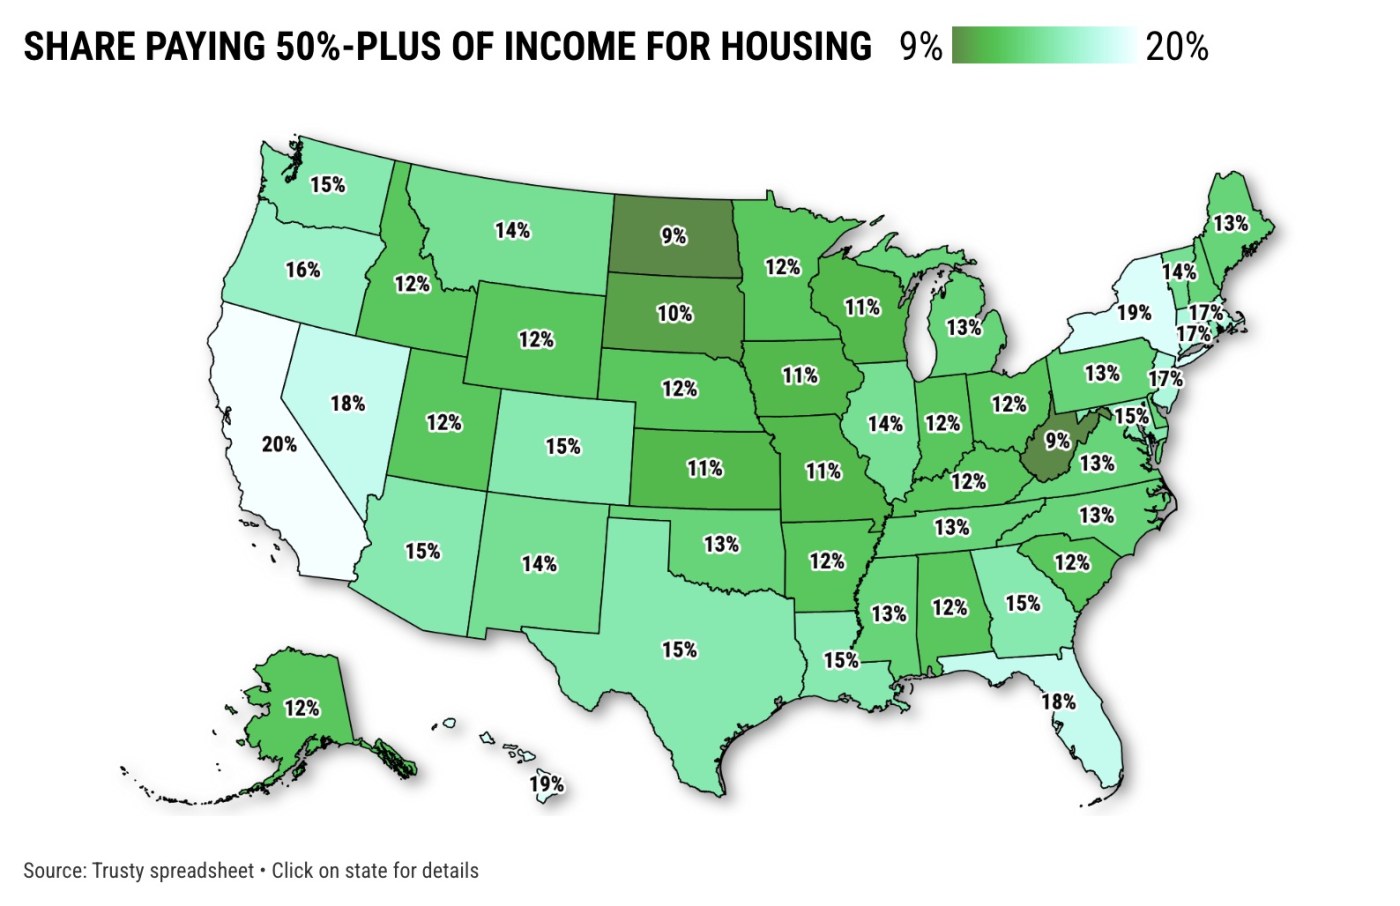
The source: My trusty spreadsheet looked at the latest Census Bureau stats tracking household expenses in 2023, focusing on what government experts call “extreme burdens” – folks paying 50% or more of their income for housing.
The pinch
California is by far the nation’s largest housing market, so it’s not terribly surprising that it’s also home to the most households spending half of their income on shelter – 2.7 million, or 14% of the nation’s 19.3 million. Next is Texas at 1.7 million, Florida at 1.6 million, New York at 1.5 million and Pennsylvania at 687,900.
What’s distressing is the size of the 20% slice of the Golden State’s population that it represents. That’s the largest slice among the states, and well above the 15% slice nationwide.
New York and Hawaii are next in shares of households spending half-plus on housing at 19%. Then comes Florida and Nevada at 18%. Texas was No. 14 at 15%.
And where is it the hardest to find deeply housing-pinched households? North Dakota and West Virginia were at 9%, South Dakota at 10%, and Iowa and Missouri at 11%.
Pressure points
Related Articles
Mountain View affordable homes project pushes ahead with property deal
California has 13 of the most unaffordable small US cities
San Mateo County approves use of $18 million in federal funds for affordable housing
Candidates looking to fill open Berkeley council seats weigh in on encampment policy
Bay Area home sales fall in September, even as mortgage rates decline
This metric is just more evidence that family finances are far worse for renters.
Yes, California has the most folks paying 50% or more to the landlord, at 1.63 million. That’s 15% of the US total, followed by Texas at 993,500, New York at 934,800, Florida at 843,500, and Pennsylvania at 373,100.
But perhaps surprisingly, California ranked only fourth-highest for share of renters paying half-or more at 28% vs. 26% nationally.
Tops was Florida at 31%, then Louisiana at 30%, and Nevada at 29%. Texas was No. 17 at 25%. Lows? North Dakota at 16%, then Wyoming, South Dakota and Kansas at 19%.
Not that owners – those with or without mortgages – escape this high-cost category. The pain is just far less.
Again, California ranked No. 1 at 1.1 million owners saddled with housing costs gobbling up half or more of incomes. That’s 13% of the nation’s 8.4 million. No. 2 was Florida at 760,800, then Texas at 685,700, New York at 537,500, and Illinois at 324,300.
Sadly, California had the highest share of its owners in this financially stressed niche at 14% vs. 10% nationally.
After California came Hawaii at 14%, New York and Florida at 13%, and New Jersey at 12%. Texas was No. 15 at 10%. Lows? North Dakota at 5%, West Virginia at 6%, then Iowa, South Dakota, and Indiana at 7%.
Politically speaking
It’s that season, so we sliced these housing-cost pressure points by which states supported President Biden in the 2020 election.
Blue states had 16% of all their households spending 50% or more on housing in 2023 vs. 14% in red states.
When it came to renters, blue states had 26% spending 50% or more, vs. 25% in red states. As for owners, blue states had 11% spending half-plus on shelter vs. 9% in red states.
Jonathan Lansner is the business columnist for the Southern California News Group. He can be reached at jlansner@scng.com


